
Bull vs. Bear Markets: The Investor's Guide to Market Cycles
Navigating the Zoo: Understanding Bull and Bear Markets
The stock market is often compared to a zoo, but two animals reign supreme: the bull and the bear. These terms aren't just Wall Street jargon; they represent the fundamental cycles that dictate the flow of trillions of dollars across global economies. Whether you are using AI-powered research on Stockinhood or managing a long-term retirement account, understanding these cycles is crucial for maintaining a balanced perspective. A bull thrusts its horns up, symbolizing rising prices, while a bear swipes its paws downward, representing a decline. This guide explores the mechanics of these cycles and how you can position your portfolio for success in either environment.
What is a Bull Market?
A bull market is a period of time in which stock prices are rising or expected to rise. While there is no official arbiter of market cycles, the standard definition is a price increase of 20% or more from a recent low. Bull markets are typically characterized by optimism, investor confidence, and expectations that strong results will continue for an extended period.
During these phases, the broader economy is usually performing well. We see rising Gross Domestic Product (GDP), strong corporate earnings, and low unemployment. In a bull market, investors are eager to take on risk. This sentiment often creates a positive feedback loop: as more people buy stocks, prices go up, attracting even more investors. For instance, during the massive expansion of the 2010s, tech leaders like Apple and Microsoft saw their valuations grow exponentially as they consistently beat earnings estimates and expanded their market share.
What is a Bear Market?
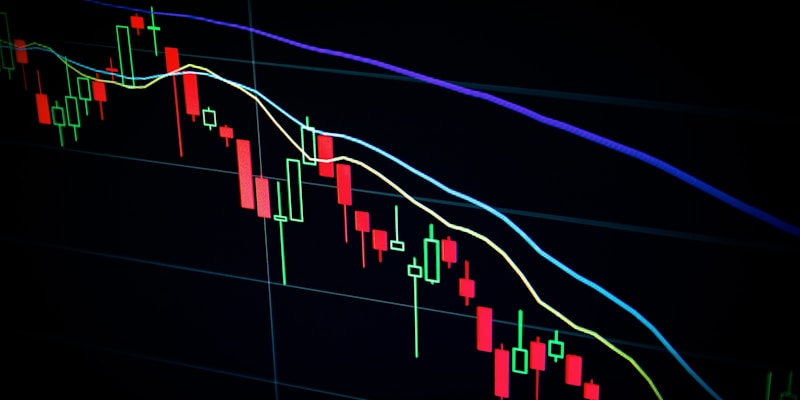
In contrast, a bear market occurs when stock prices fall by 20% or more from their most recent peak. If the bull market is a party, the bear market is the hangover. These periods are characterized by widespread pessimism and a 'flight to safety' as investors pull money out of risky assets.
Bear markets are often triggered by economic slowdowns, rising interest rates (which make borrowing more expensive), or unexpected global shocks. When the market turns bearish, even the most successful companies can see their share prices suffer. During the 2022 downturn, even industry giants like Amazon and Alphabet experienced significant drawdowns as the market re-evaluated growth prospects in a high-inflation environment. It is a time when 'fear' replaces 'greed' as the primary driver of market behavior.
Key Differences Between the Two
While the 20% threshold is the technical marker, the differences between these two phases go much deeper than just price action:
- Average Duration: Historically, bull markets are long-distance runners, while bear markets are sprinters. Since 1928, the average S&P 500 bull market has lasted nearly three times longer than the average bear market. This historical bias is why long-term investing remains a powerful wealth-building strategy.
- Psychology: Bull markets are often driven by 'FOMO' (Fear Of Missing Out), while bear markets are characterized by 'Capitulation'—the moment when investors give up and sell their holdings at any price.
- Monetary Policy: Bull markets often thrive in 'Easy Money' environments with low interest rates. Bear markets often occur when the Federal Reserve raises rates to combat inflation, tightening the money supply.
Notable Market Cycles in History
- The Great Expansion (2009–2020): Following the 2008 financial crisis, the market entered its longest bull run in history. This era was defined by the rise of 'Big Tech' and the dominance of the Nasdaq-100. Companies like NVIDIA transformed from niche chipmakers into global powerhouses during this window.
- The COVID-19 Crash (2020): One of the fastest bear markets in history, where the S&P 500 dropped over 30% in a month, followed by an equally rapid recovery fueled by government stimulus.
- The 2022 Inflationary Bear: A classic example of a bear market caused by macro-economic shifts, where rising rates hit growth-sensitive stocks like Tesla particularly hard.
Strategies for Every Market Environment
Investing During a Bull Market
When the trend is up, the goal is to maximize participation while staying disciplined.
- Look for Leaders: Identify companies with 'moats' and strong earnings power. Using Stockinhood's AI tools can help identify which sectors are leading the charge.
- Avoid Over-Leverage: It is tempting to take on excessive risk when everything is going up. Maintain your original risk tolerance.
- Rebalance Regularly: If your stocks have grown significantly, they might now represent a larger portion of your portfolio than intended. Selling a small portion of winners like NVIDIA to move into other sectors can help manage risk.
Strategies for a Bear Market
Bear markets are where 'smart money' often does its best work. As the saying goes, 'be greedy when others are fearful.'
- Dollar-Cost Averaging (DCA): This involves investing a fixed dollar amount on a regular schedule, regardless of price. When the market is down, your fixed investment buys more shares, effectively lowering your average cost over time.
- Dividend Reinvestment: Companies with strong cash flows, such as Berkshire Hathaway or traditional dividend payers, provide a cushion during volatility.
- Focus on Fundamentals: Use bear markets to buy high-quality companies at a discount. If the long-term thesis for Microsoft hasn't changed, a lower price is an opportunity, not a threat.
Market Corrections: A Mid-Point
It’s important not to panic at every dip. A correction is a decline of 10% to 20%. These are incredibly common and usually occur about once a year. They are 'healthy' for the market because they prevent bubbles from forming and allow the market to 'reset' its valuations without falling into a full-scale bear market.
How AI Helps Navigate Volatility
In the past, investors had to rely on delayed news and gut feelings. Today, Stockinhood’s AI analyzes real-time sentiment, technical indicators, and fundamental data to provide a clearer picture. AI can help identify when a bull market is becoming 'overextended' or when a bear market is showing signs of a 'bottom' based on historical patterns and volume analysis.
Summary and Key Takeaways
Market cycles are an inevitable part of the financial landscape. By understanding that bulls and bears are two sides of the same coin, you can remove the emotional weight of market swings.
- Stay Patient: Bull markets typically last longer and provide the bulk of total returns.
- Be Prepared: Bear markets are inevitable but temporary. They are often the best times to accumulate wealth for the future.
- Diversify: Holding a mix of assets ensures that no single market swing can wipe out your progress.
- Focus on the Long Term: Short-term fluctuations are noise; long-term corporate earnings drive stock prices.
Disclaimer: This article is for educational and informational purposes only and does not constitute financial, investment, or legal advice. Investing in the stock market involves risk, including the potential loss of principal. Always conduct your own research or consult with a qualified financial advisor before making investment decisions. Past performance of stocks like AAPL, MSFT, or NVDA is not a guarantee of future results.
Stockinhood AI
AI-Generated Content
Disclaimer: This article is for informational and educational purposes only and does not constitute financial advice. All AI-generated content should be independently verified. Past performance does not guarantee future results. Consult a licensed financial advisor before making investment decisions.
Related Articles
Ready to dive deeper?
Explore AI-powered stock analysis and market research tools.
Explore Stockinhood